Responses tab - Case Content view of Reports
On the Responses tab, all parts/checklists filled out for the different Cases can be accessed and filtered by Case, Activity, and Learner groups.
This tab allows cross-Activity results when more Activities are included.
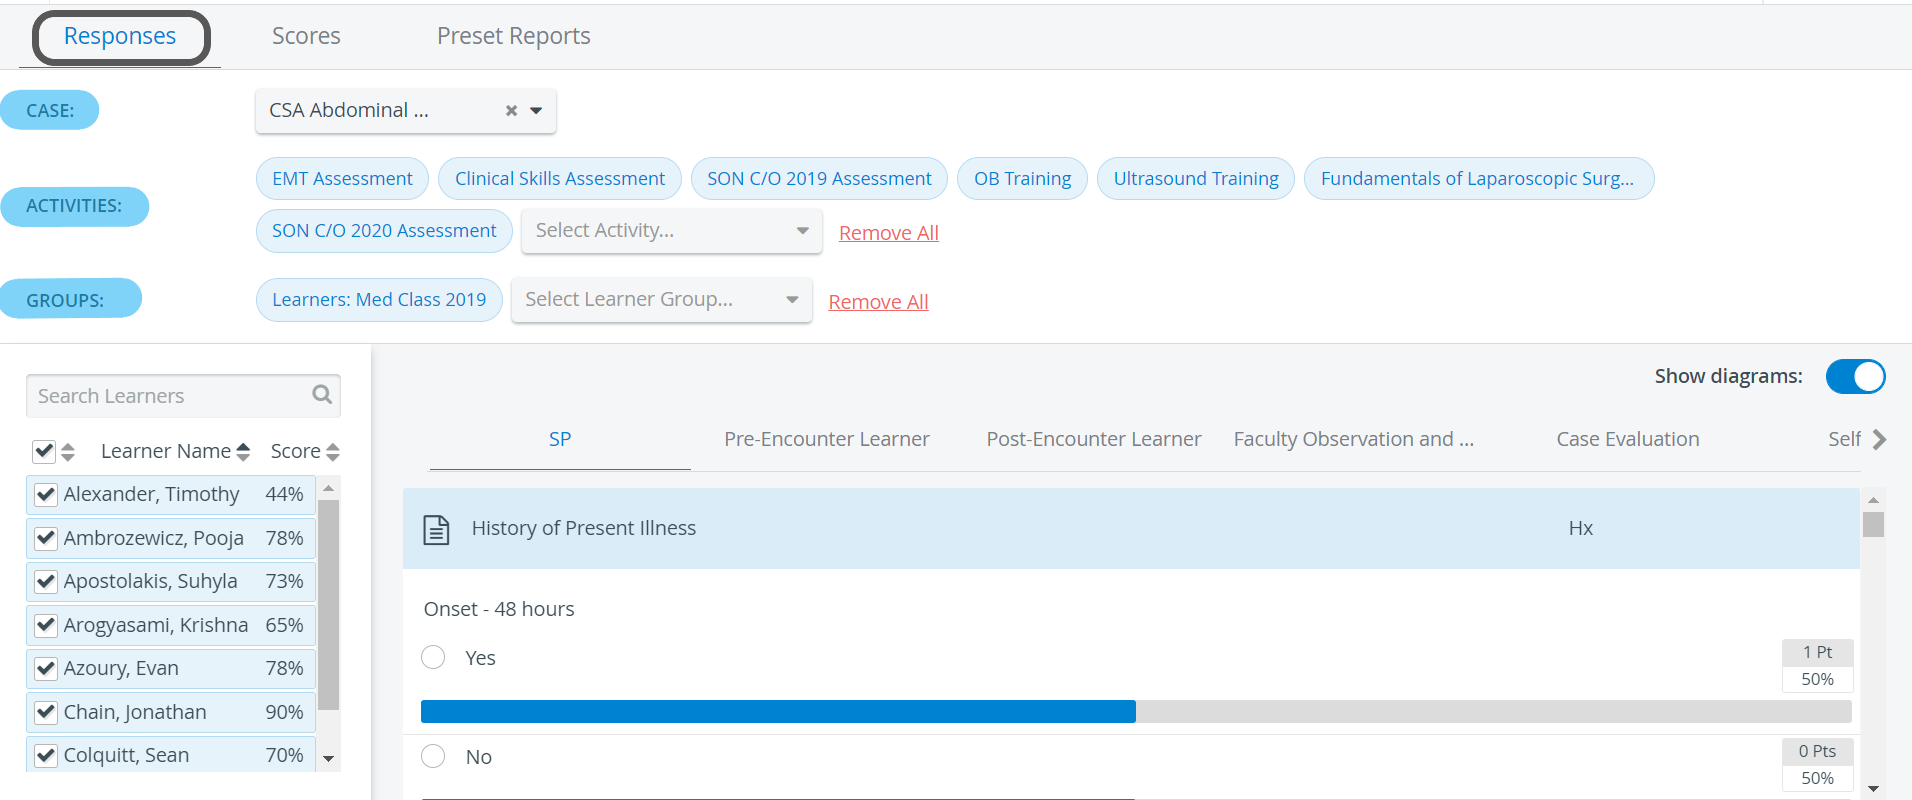
Users with Report Reviewer and Report Reviewer (full control) privileges have access to the Responses tab for those Activities in which they are members of the assigned Faculty group.
Such Activities are listed in the Your Activities panel on the user's Dashboard.
Report Reviewer access may be limited via the Reports tab of the Edit Activity pop-up.
If more than one Activity is added (and the user can access them), the union of all submitted checklists for the selected Case is displayed. Therefore, if a learner submits the same checklist within several different Activities, their name will be listed that many times.

Selecting a Case generates a list of learners who have already submitted for that Case (i.e., have had checklists completed for their accounts). The checkboxes next to the names provide additional filtering options. Scores are shown as percentages in the Score column next to the learners' names.
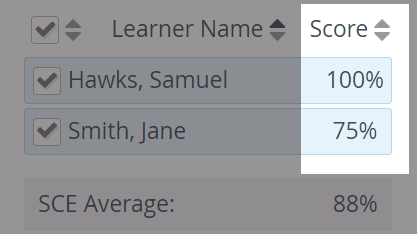
Scores are displayed in brackets when a relevant checklist includes any open-ended question that has not yet been scored. If no score is displayed (only a dash) next to a learner's name, it means the learner has opened the checklist but has made no submission. (Learners who have not opened the checklist are not listed.)
Statistical data
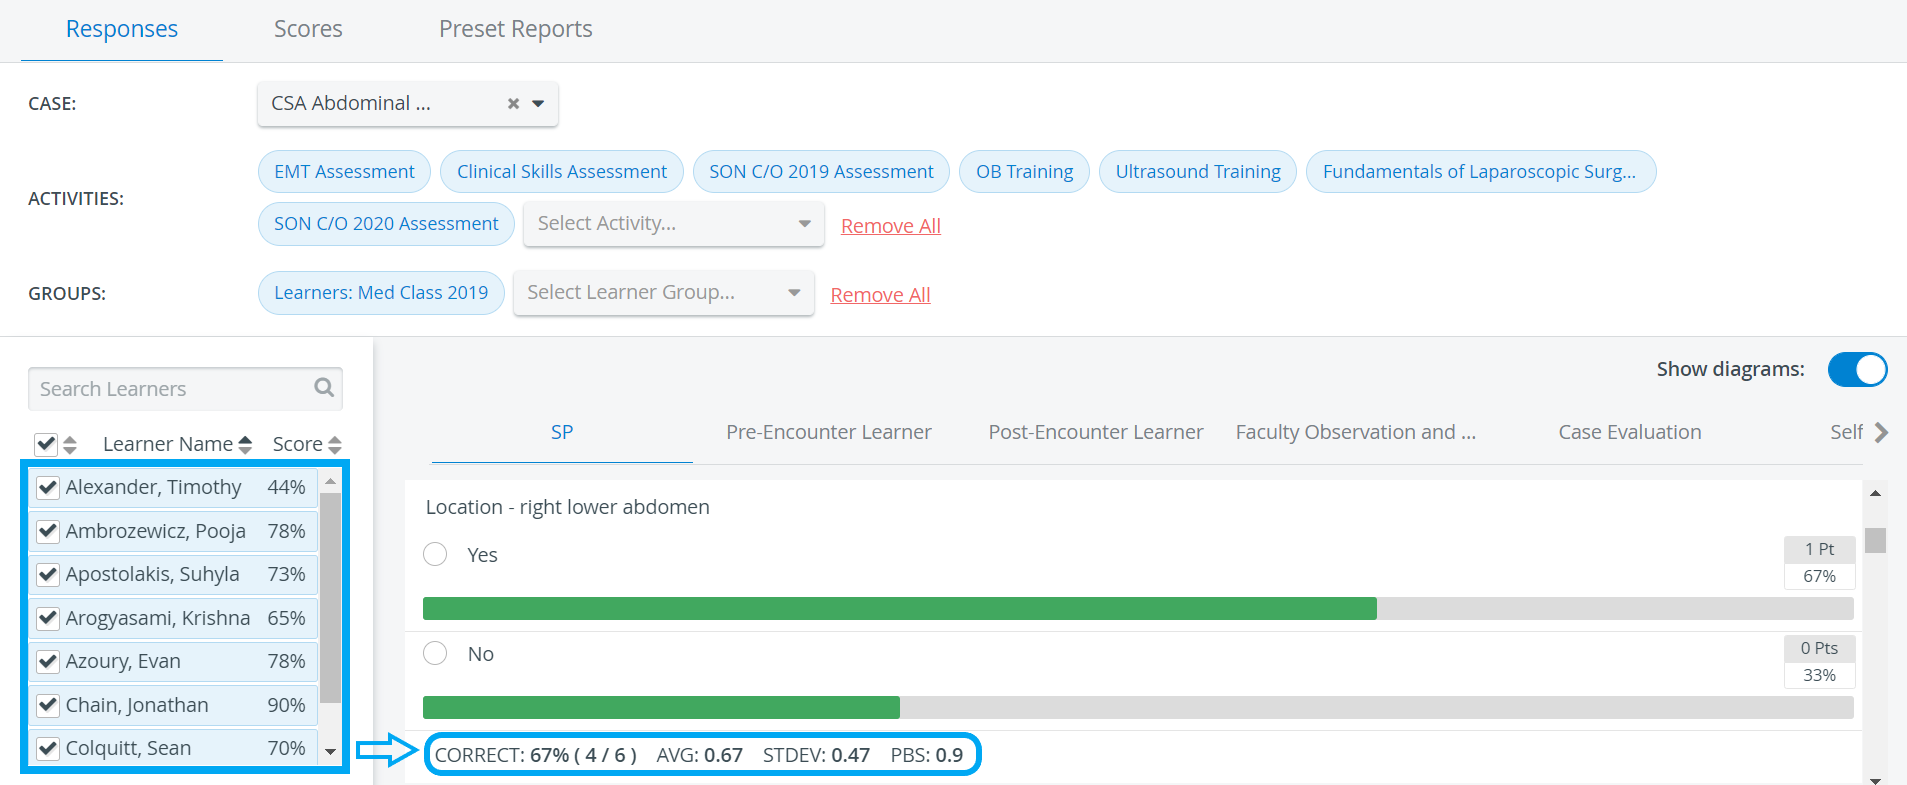
Responses can be compared statistically by selecting the radio buttons next to the answers. As radio buttons can be selected for multiple items, multiple filtering can be applied.
The statistical data include the percentage of correct answers, the mean, the standard deviation, and the point-biserial correlation. The last one helps evaluate the pertinence and efficiency of a question (i.e., an item of a checklist).

Statistical data is only displayed if all or multiple Learners are selected from the Learners' list.
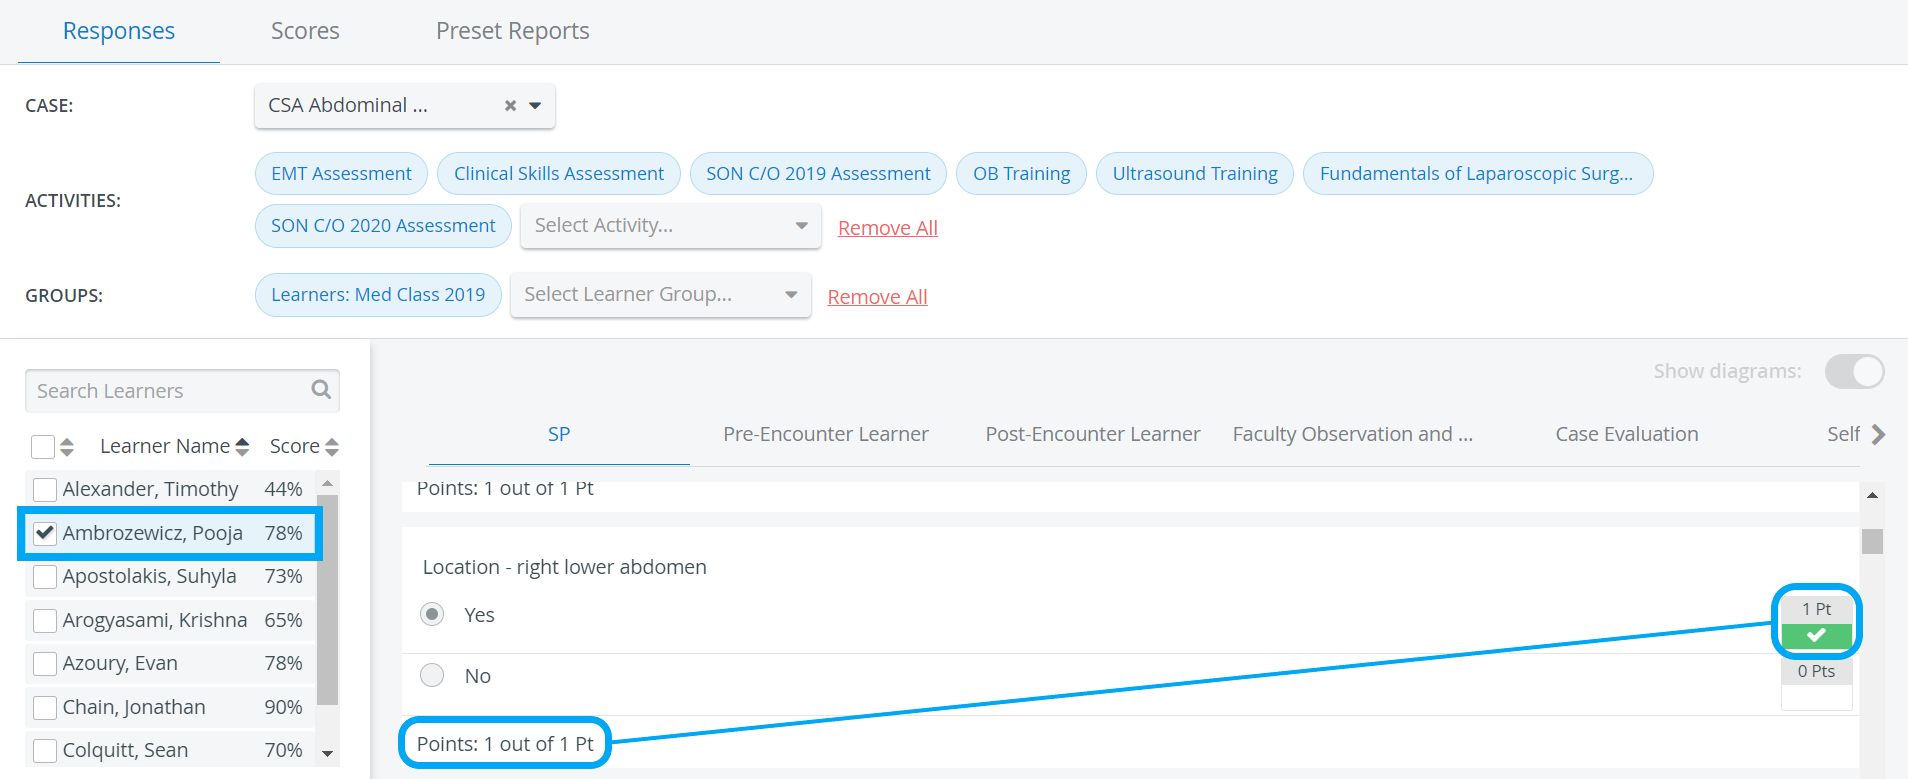
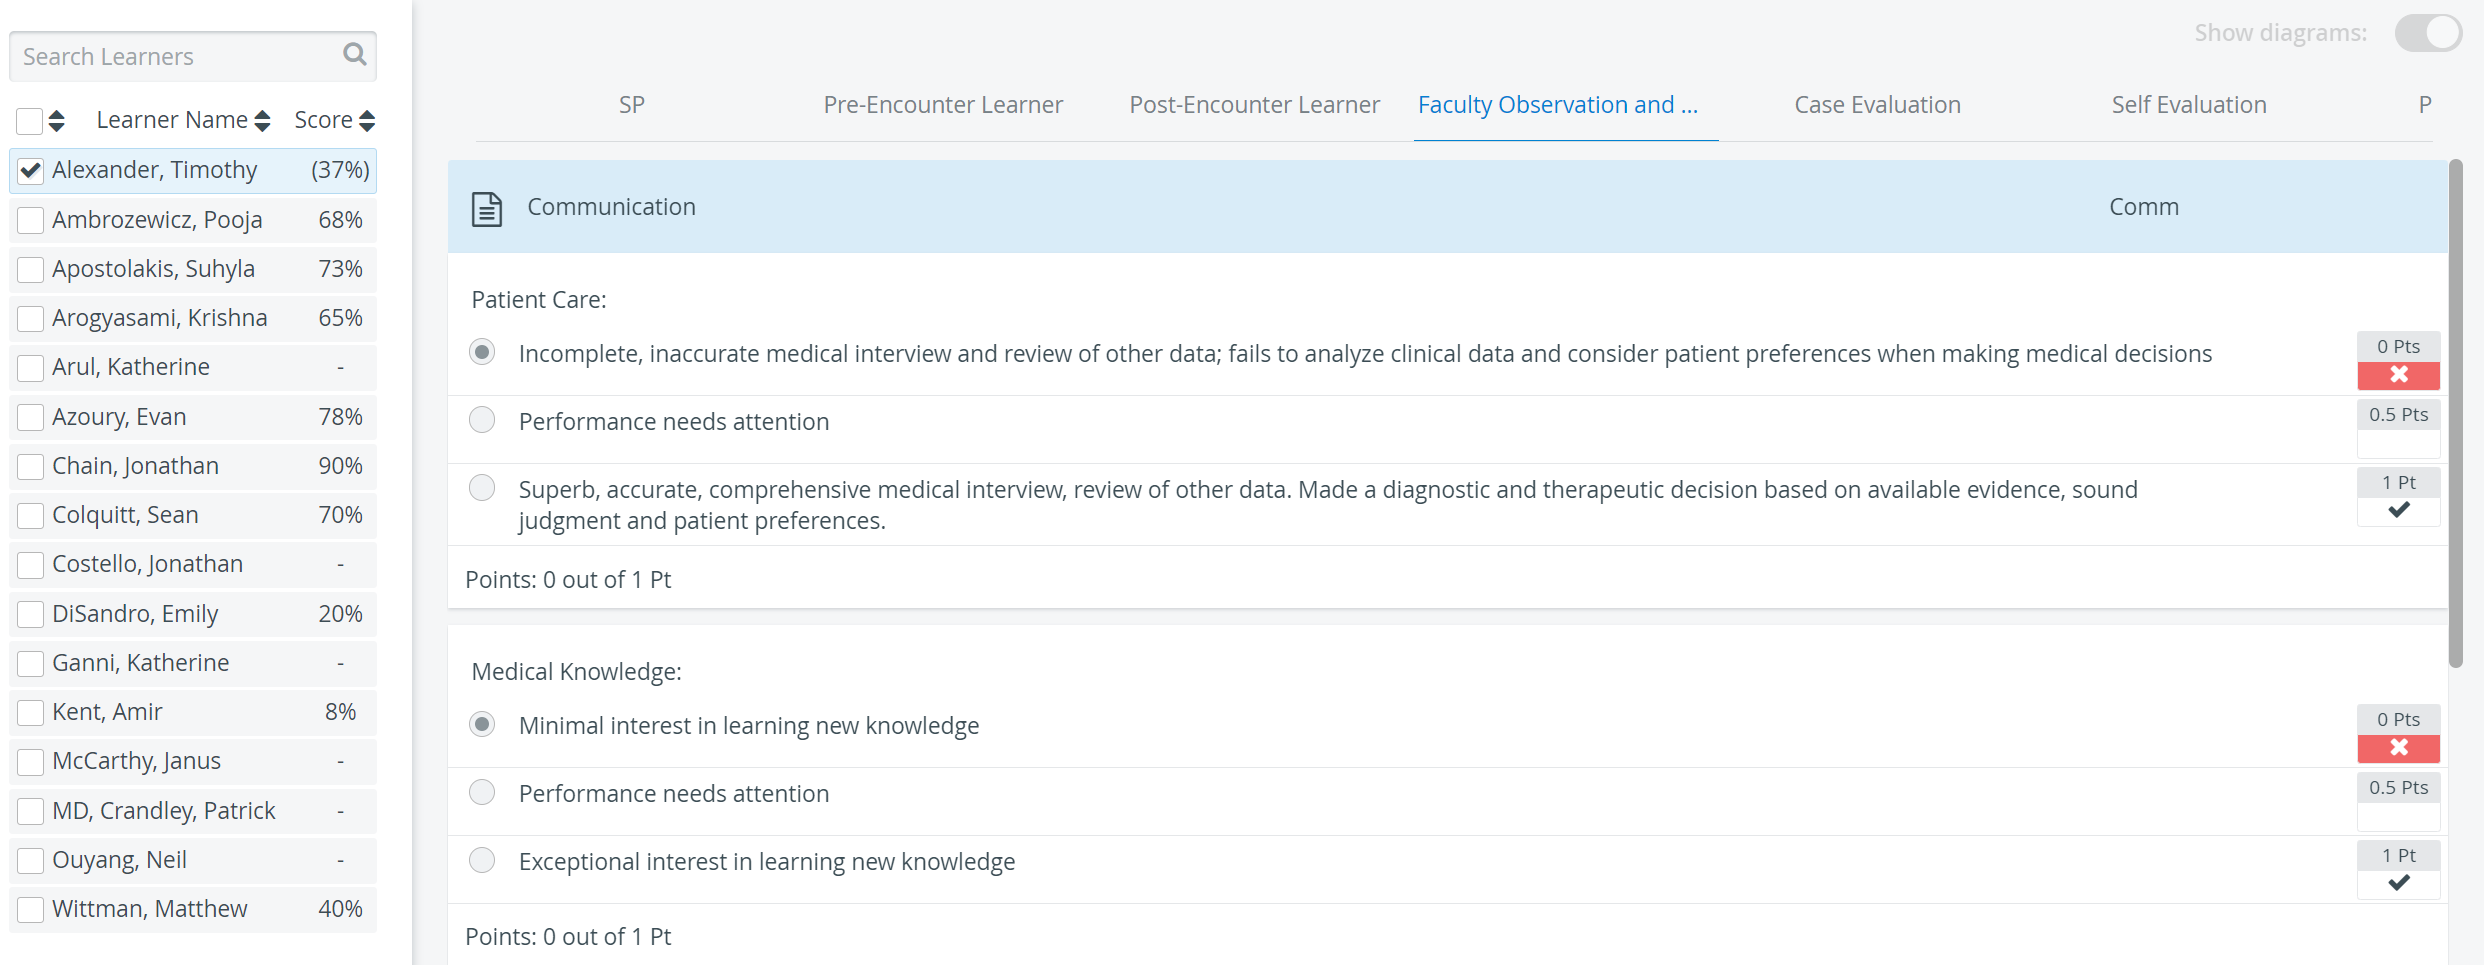
In case only one individual Learner is selected, the following information is displayed under Responses:
selected versus correct answers,
points (achieved/achievable),
Learner Score.
In case it is not the Learners' response that is being scored,


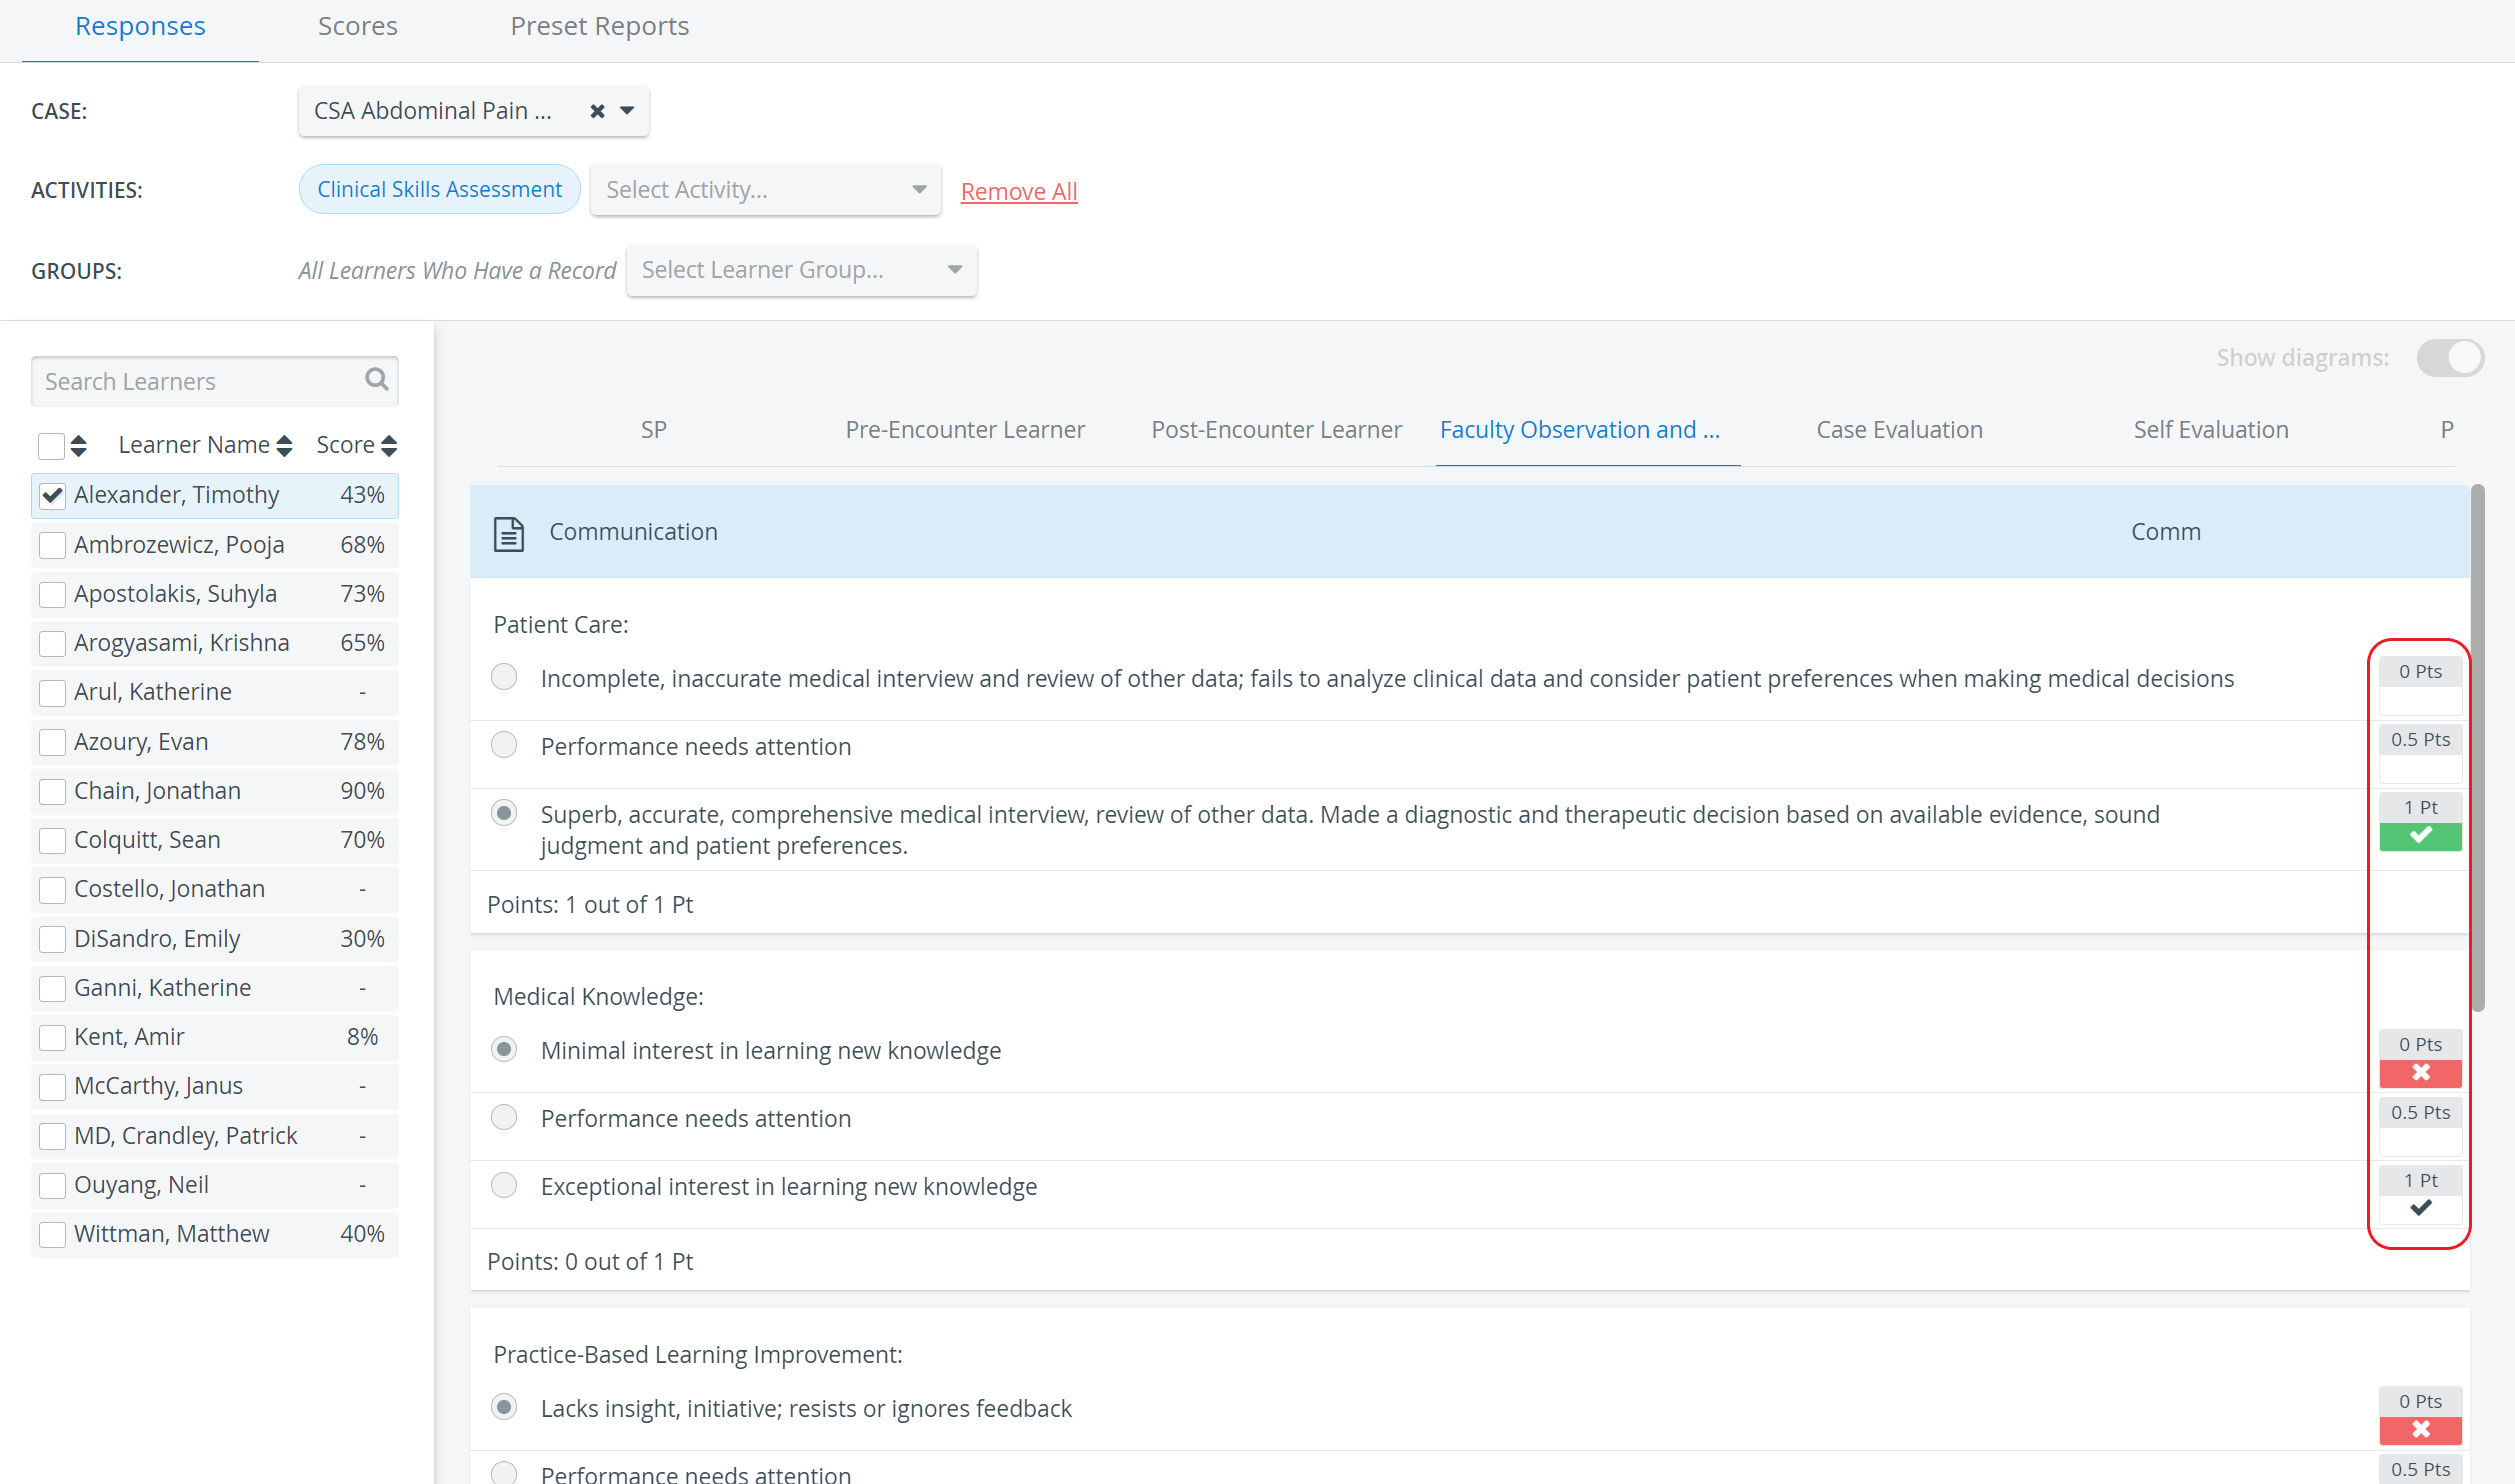
If the Multiple independent SP & FON submissions allowed option is enabled in the Activity editor (Options tab), the answer values will not be displayed.
Dynamic subgroups
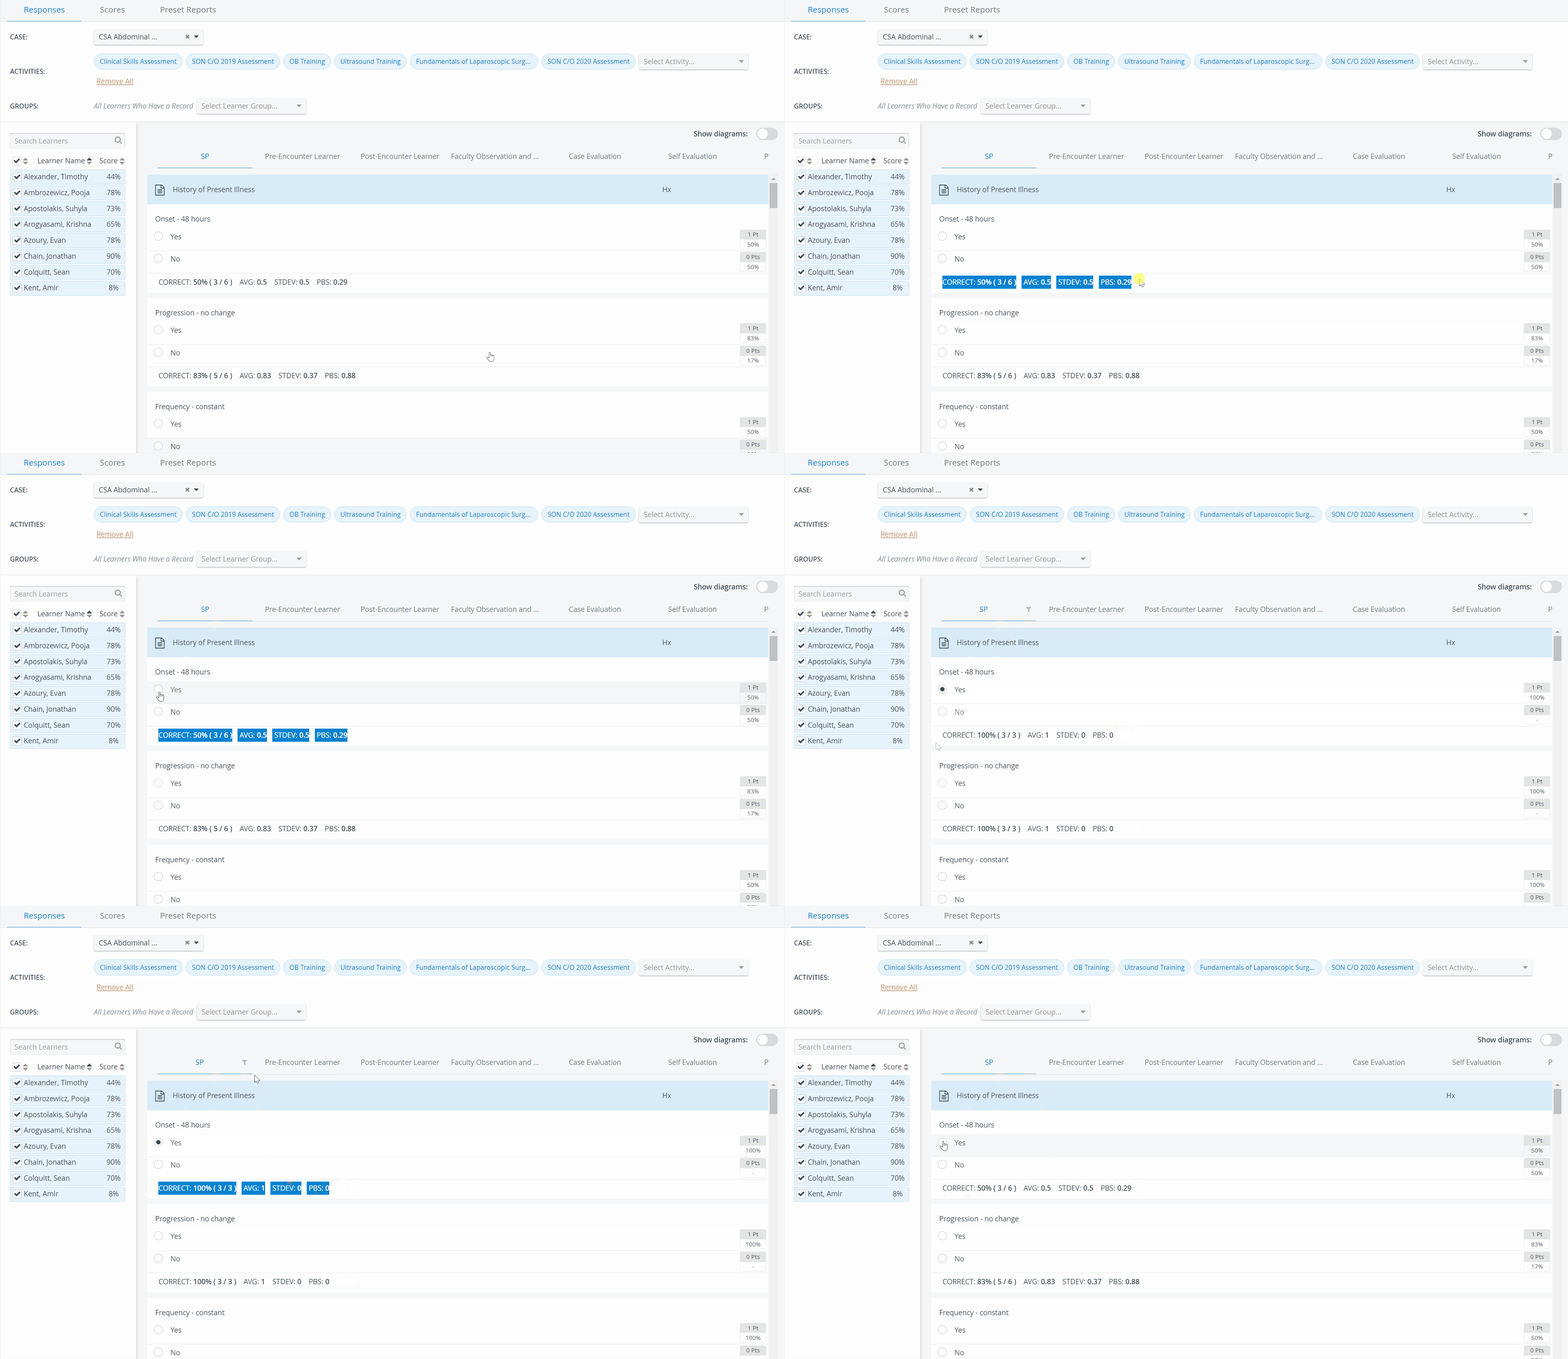
Using dynamic subgroups provides you with another filtering option. With their help, you can compare the performance of the subgroups of learners with similar results for a particular item.
To filter results according to dynamic subgroups:
Select the radio button in the line of the item from the answers of which you want to choose a subgroup.
The system will then display responses only for those who have given the same answer for the selected item. This will provide information on how these respondents answered all other items on the checklist, enabling further comparison or statistical analysis of the data.
A Filter icon next to the part type/header shows that you are currently operating with a dynamic subgroup.


See also: What Is A Dynamic Subgroup.
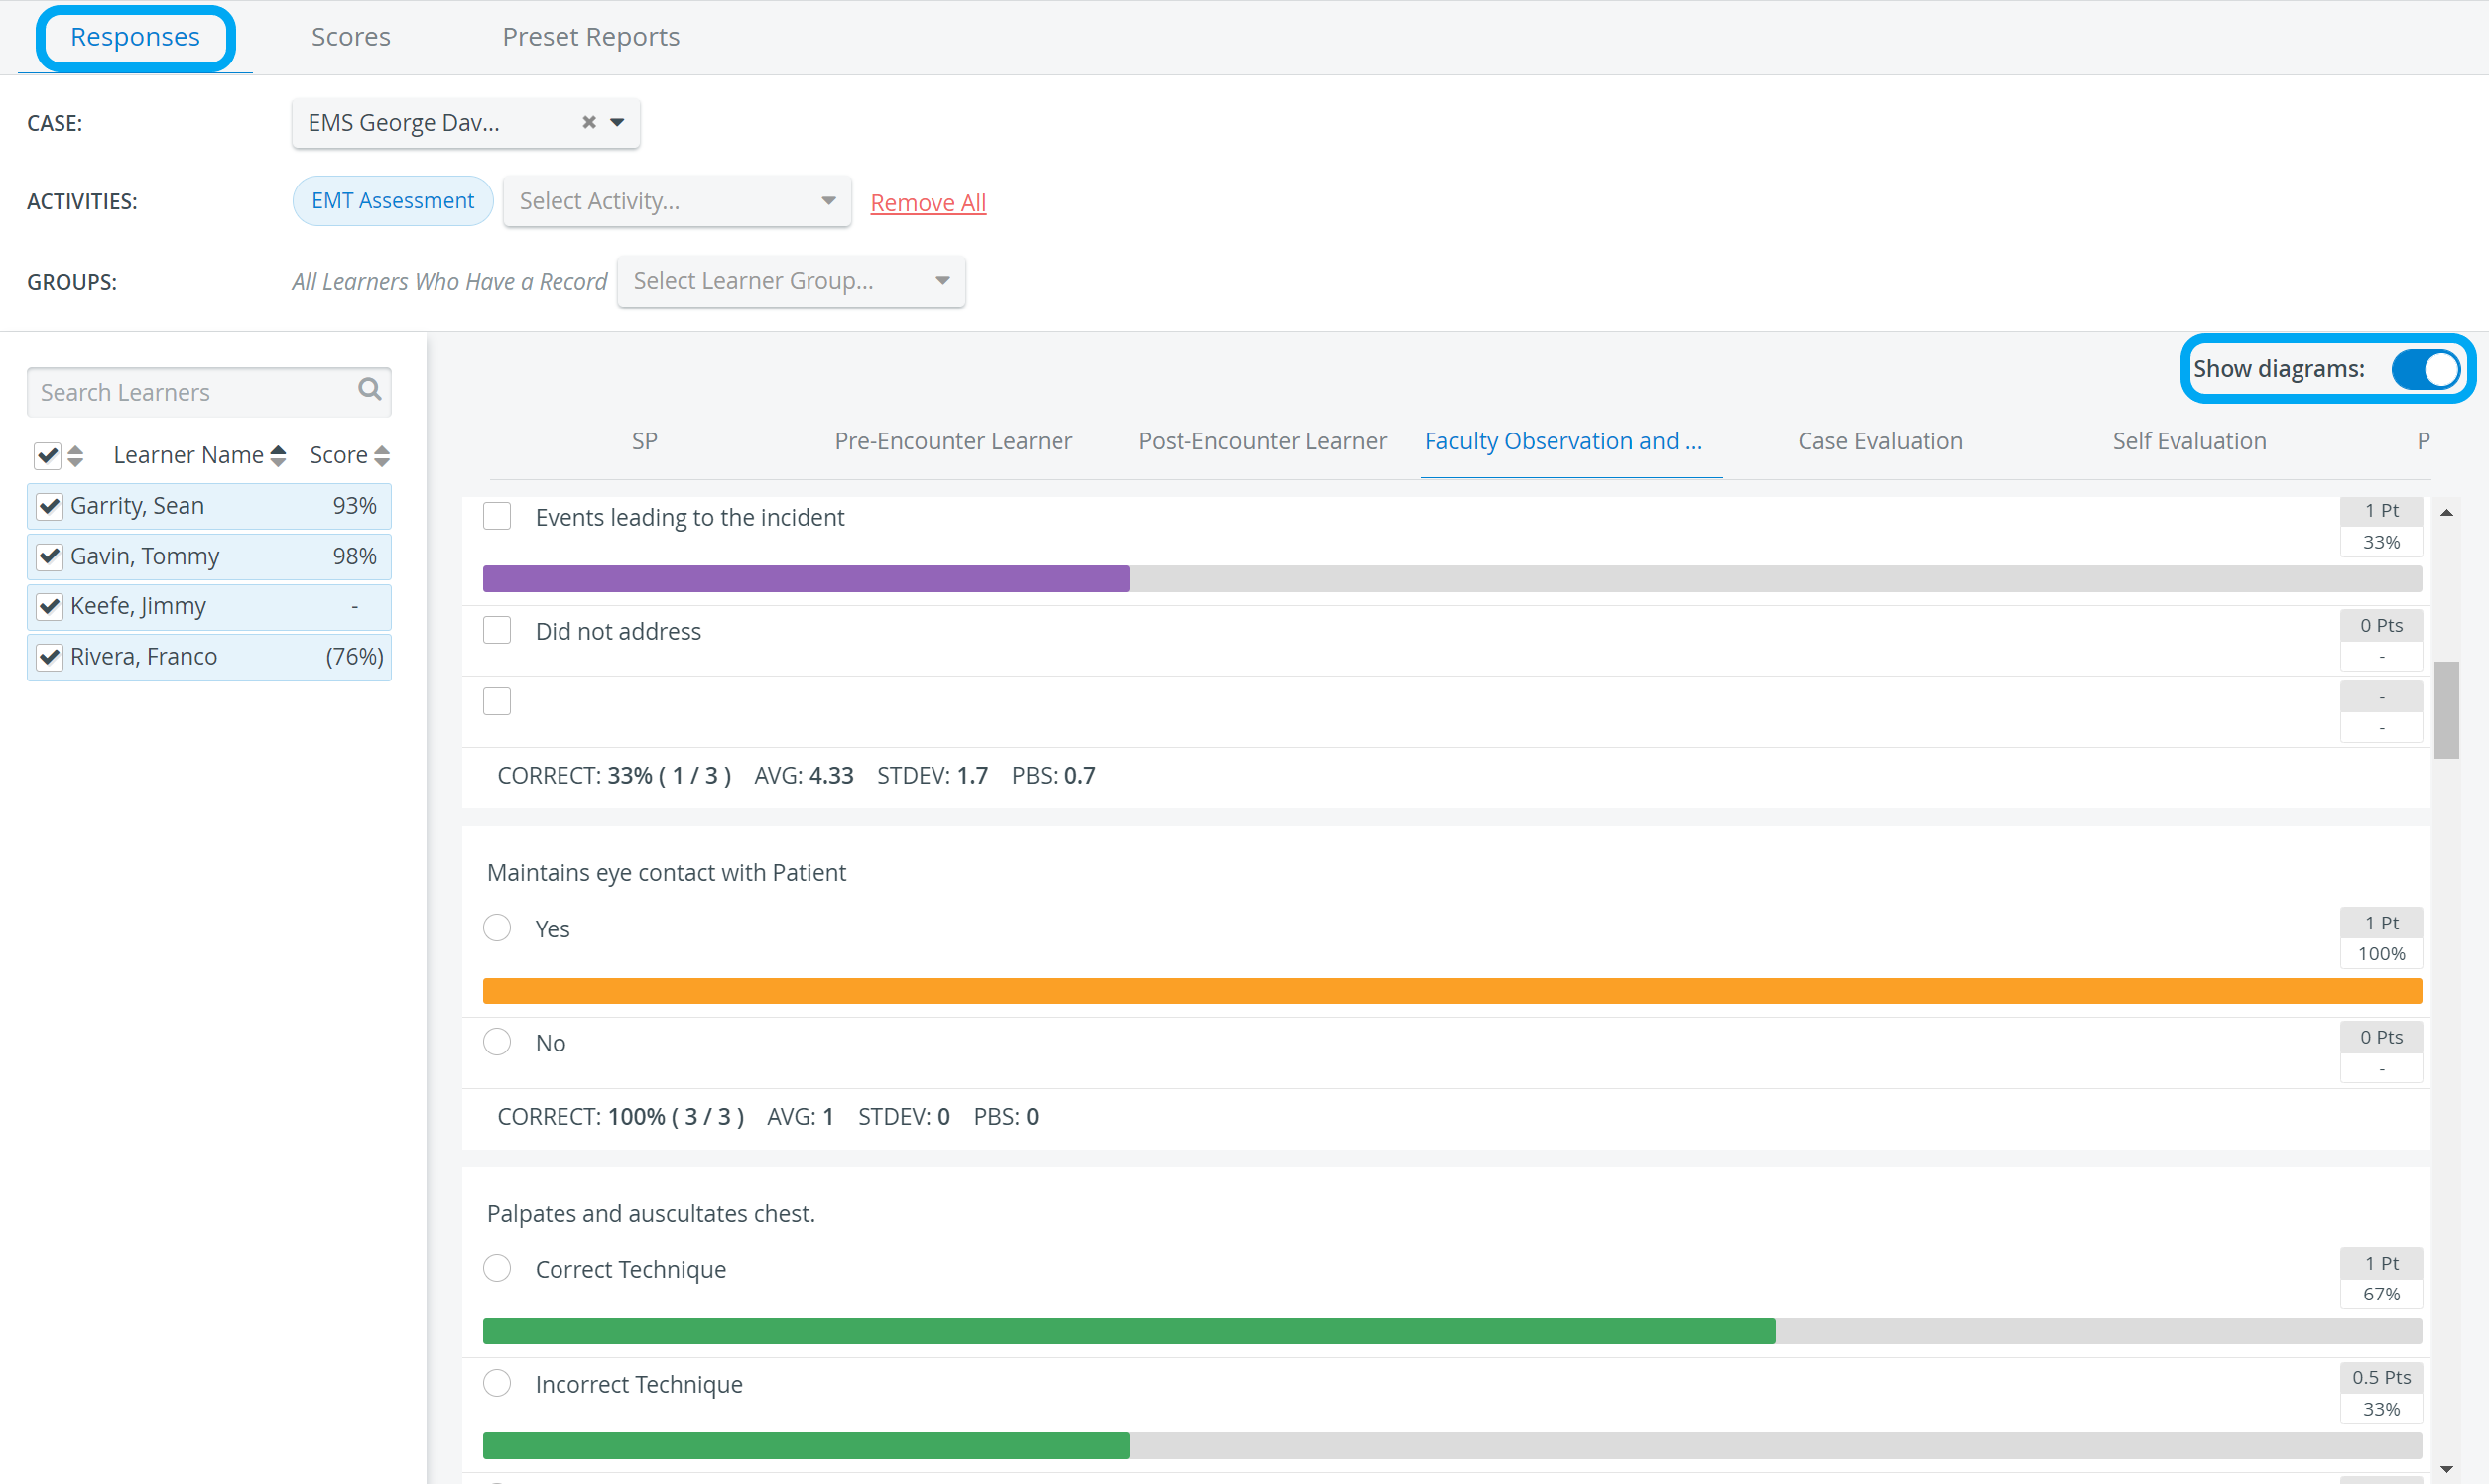
Show diagrams
With the Show Diagrams option enabled, statistical data can be displayed in a more visualized way:
For further information, see the Reports - How to pages and the Reports Module Training Videos.