Comparative Numbers
Certain numbers help illustrate the performance of learners relative to that of a whole class or express any irregularities in the average performance of a class.
Standard Deviation
The Standard Deviation indicates how far a quantity is likely to deviate from its average value. In LearningSpace, it corresponds to a range where most of a group of learners' results belong, in other words, how close the learners' results are to each other.
This can help
compare a learner's result to that of the whole class
and, by extension, it can also provide feedback about the applicability of the Cases.
If the standard deviation is either too big or too small, it could mean that something needs to be adjusted in the Activity management.
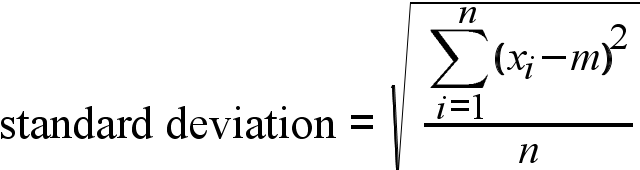
x = one particular kind of score of each learner in a learner group
m = mean performance of the learner group - calculated from the same kind of scores
n = number of learners in the learner group
You can calculate standard deviations for different groups of data, for example, for different levels of scores:
item results,
section results,
Case results
and Activity results.

Z-score
The Z-score always refers to the performance of a single learner: it reflects how much a specific learner's performance differs from the average. It is calculated from the learner score for a particular part of the Activity, a class average for the same scores, and the standard deviation calculated from the preceding two numbers.

l = any kind of learner score
a = the class average calculated from the same kind of scores
d = the standard deviation calculated from the same scores and average
If this value is below -1 or exceeds +1, it means that the learner's section performance falls outside the class standard deviation. They performed much better or worse than average in that section of the Activity. If a learner's Z-score is near 0, it means his section score is near the class average.

Percentile Score
The Percentile Score refers to a specific learner and indicates what percentage of the class (more precisely, the learner group) performed worse than (or the same as) that learner.

nw = number of learners whose particular performance was worse than or the same as that of the learner
n = number of learners of the learner group of the Activity who have a record for the certain score
Percentile scores can be calculated for different scores, such as section, Case, and Activity results. The percentile score is 100% for the best-performing learner(s), while 0% for the weakest one.
IMPORTANT: Due to the calculation method, the percentile score is 100% for the strongest learners, even if there is more than one with the same result, whereas it will be slightly above 0% for the weakest learners if there is more than one. The value of this score also depends on the decimal display settings made on the Activity Reporting Setup page, because the percentile score calculation uses the displayed values.
For further information, see the Reports - How to pages and the Reports Module Training Videos.